

 We spend a lot of time in this state talking about affordability, costs of living, and income distribution. These are fascinating topics, but any one-size-fits-all discussion necessarily leaves people out: “Affordability” means different things to different people, and it means different things depending on the stage of your life you’re in. The cost of living in El Paso can be high if you eat at expensive restaurants every night and want a 4,000 square foot house; the cost of living in Houston can be cheap if you are into eating noodles with garlic butter every night and you’re happy to rent a tiny apartment.
Mapping costs of living and affordability for ranking purposes, therefore, is a tricky task. Everyone’s circumstances and needs are pretty different, and it’s hard to account for all of that variation.
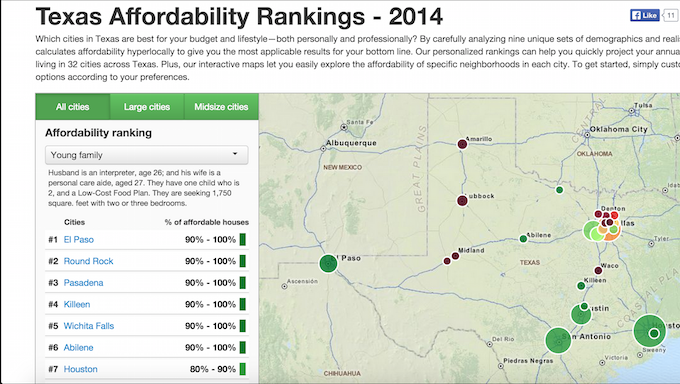
However, over at Fixr.com—a website that specializes in connecting people in various states to local businesses and contractors—they’ve used their hyperlocal focus to create maps that are more specific, depending on a person’s needs and lifestyle, for their Texas Affordability Rankings.
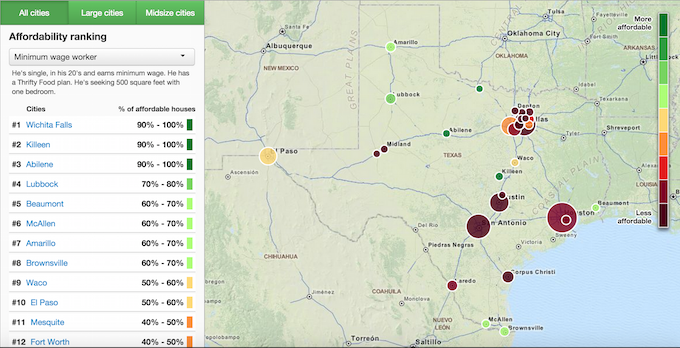

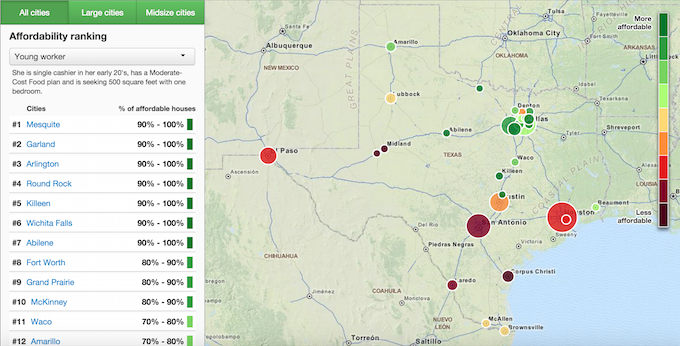 The two maps above, for example, outline a similar scenario: Young people in their early twenties with entry-level jobs. The first map is for a minimum wage worker, while the second one is for someone who works retail, but at a slightly higher hourly rate.
Looking at the first map essentially tells you what Texas cities have the lowest cost of living, without adjusting any variables. Since the minimum wage is the same in the DFW Metroplex as it is in the Rio Grande Valley, the first map factors in the cost of housing, food, transportation, etc, and determines that Wichita Falls, Killeen, Abilene, Lubbock, and the Valley are the most affordable places to live on an unchanging $15,080 a year.
The second map, though, is more informative: The hypothetical cashier’s lifestyle it explores involves a food plan that’s a bit more expensive—maybe eating out every so often, instead of a strict diet of canned beans warmed up on a space heater—but the map changes dramatically as it accounts for different wages in different places. Mesquite, which is largely unaffordable on minimum wage, becomes the top prospect, while McAllen is marginal. The reason is pretty simple: In Mesquite, someone who fits the “works as a cashier, lives in a 500 square foot apartment” profile makes just upwards of $20,000 a year. In McAllen, meanwhile, she’d take home closer to $18,000. The wages are higher in North Texas, but the expenses are largely the same.
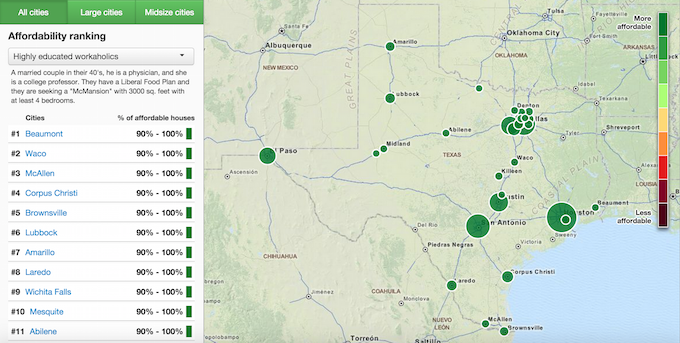

Other maps are a bit less insightful. (Check it, if you make over $200,000 a year, pretty much everywhere is awesome for you.) But the variable can still be instructive: You’ll have more disposable income if you buy a McMansion in Beaumont than in Houston, for example. But the real details get more interesting if you break it down by Census tract, which the maps allow you to do. Take a look at a hypothetical Houston family where one partner is a librarian and the other is a systems analyst, with two kids:
Even with a very, very healthy annual income of $160,000, in that example, there are parts of the city that are essentially off-limits to the family, and others where finding housing would be legitimately challenging. There’s no need to cry for the poor imaginary family who can’t afford to live in West University Place, but it’s interesting to see a map recognize that cities, like states, aren’t monoliths. The statewide difference becomes even more apparent when you move the same family over to Killeen:
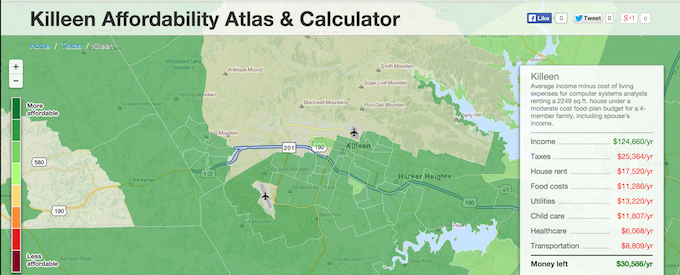
 In Killeen, the family could comfortable settle down anywhere they chose—but their annual income would be over $30,000 a year less than in Houston. But with significantly lower rent and taxes, the net difference would still end up with the family keeping more money in the bank every year.
All of which is to say: Visualized data doesn’t always lead to broad conclusions, but it’s an important way to consider the multitude of factors that go into concepts like affordability and cost of living. In some parts of Texas, less money equals more money; in other places, a low cost of living can still leave you in poverty because of low or stagnant wages. Taking a look at that much bigger picture, with a way to dramatically adjust the variables, leads to a healthier understanding of these ideas.


